How much do brokers make on the loads you haul? How much do they deserve to make, and can they be trusted to honestly report the numbers?
It might just be the most heated conversation in trucking, with groups like the National Owner Operators Association outright accusing big brokers, mega carriers, and load boards and other freight-data analytics providers of either manipulating rates data, or allowing deception on the platforms. For instance, NOOA engages in frequent sparring matches with DAT Chief of Analytics Ken Adamo on Twitter (now called X) over just how much brokers are really making off their hauls.
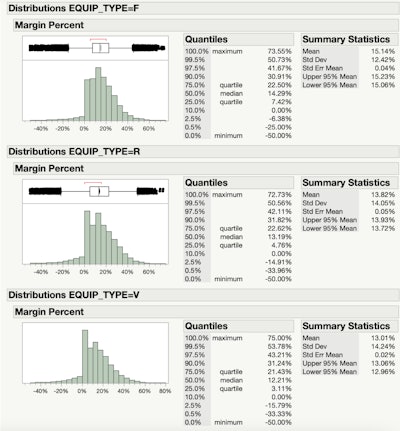
Adamo, for his part, made himself available to questions and encouraged skepticism and constructive feedback on the company’s data products. Despite this, and his rigor in sharing sources and methodology, many remain unconvinced. A recent nine-page study from Adamo looked at data submitted by DAT's customers and reported back analysis of the margins posted by brokers, as shown in the chart below. Flatbed brokers came out with the highest mean (average) margin of more than 15%, with reefer (almost 14%) and dry van (13%) following.
 “When looking at margin percentages by equipment type," according to the published paper, "flatbed (F) comes in on top with a mean margin of 15.14%, followed by refrigerated (R) at 13.82%, with dry van (V) at the lowest margin" at 13.01%. The mean (average) margin reported among all the loads in the sample was 13.47%DAT's Ken Adamo
DAT gets the numbers from customers who become "contributors," or undergo an onboarding process where they learn to submit standardized data reporting which is "verified by both DAT and the customer to be correct," according to Adamo's study. The contributors were brokers and broker/carrier customers, and most submitted data "directly out of their TMS systems."
The paper contains a few ideas for avoiding brokers reaping a high margin from your haul.
Interestingly for the long-distance OTR crowd, the study found that "margin decreases as the length of haul increases," which Adamo attributed to fixed costs of truckers and brokers on a per-load basis amortizing over longer distances. The average margin under 250 miles sat at 15.2%. The 1,000-plus-mile haul segment sees just 11.7% average margins for brokers.
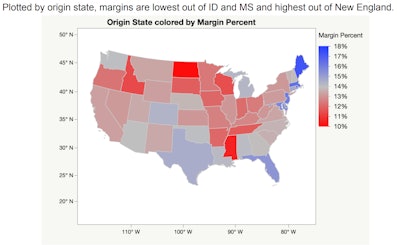
According to DAT's data, the map below shows the load-origin states where brokers reap the highest margins -- another area an owner-operator can gut-check the findings.  Do brokers have an easier time booking loads out of Florida, Maine or Massachusetts than in Idaho, North Dakota, or Mississippi?Ken Adamo
But to get value out of the report, one has to trust the underlying data. A NOOA spokesperson contended these numbers weren't audited by a party outside DAT itself, and that DAT puts disclaimers on their data products warning users to use the data at their own risk.
That's all true, but DAT's numbers line up with other publicly available figures that do undergo independent scrutiny. Publicly traded brokerages, who are subject to independent audits and face stiff federal fines and penalties for misconduct, offer another potential example of real-world margins.
C.H. Robinson, in its latest quarterly release, said it made $386 million in adjusted gross profits (gross revenue less labor, overhead costs) on about $3.1 billion in revenue. This isn't an exact "broker margin" calculation, but that comes out to a 12.45% profit margin for the company overall. That profit number is down 31% year-over-year. In the comparison quarter in 2022 (Q3), Robinson noted it made 563 million on $4 billion, about 14% profit. J.B. Hunt's 360 brokerage has faired similarly over the course of the rates downturn, according to the company's latest quarterly earnings.
A few recent broker bankruptcies, like Convoy's $3.8 billion collapse and back in June the implosion of Mississippi-based Transplus Freight System, made headlines, too. Kevin Hill of Brush Pass Research recently posted on LinkedIn that, according to the latest numbers, in December broker authorities have seen negative year-over-year growth of about 6%.
Of course, carriers are going out of business too. Assuming a few raw deals from a hard-negotiating broker might sink a shaky trucking business, it's important to watch every percentage point.
[Related: Convoy's collapse: Was the tech worth the hype?]
Interrogating the broker-margin numbers
Adamo's paper passes the sniff test in particular ways, for instance showing a big uptick in loads booked for just above a zero percent margin. This suggests brokers, as with truckers, really don't like to lose money on loads. Some percentage of the time a broker tells you a price is their "bottom dollar," they might just be telling the truth.
Owner-operators among NOOA's membership aren't exactly buying it, though. Officially, NOOA has launched a boycott of big brokers like TQL and Hunt over transparency issues.
Remember the 44% margin this owner-operator in December noted she discovered on a TQL load after FMCSA compelled the broker to provide the documentation? Many owner-operators, including among NOOA's members, suspect that high margins like that may be closer to the norm than any major industry figure wants to admit.
[Related: FMCSA investigates TQL as fight over broker transparency rages]
Adamo's white paper sought to dispel that with a sample of "500,000 randomly selected shipments from 521 unique contributors" among brokerages, "totaling $930m in shipper revenue and $803m in freight spend," according to the white paper. The samples included short hauls and long hauls, and "consisted of 70% van, 16% flatbed, and 14% reefer" as far as equipment types go.
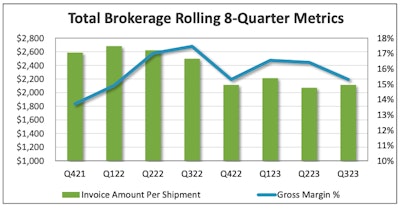
Again, the entire study showed about a 15% margin for brokers, which is in line with what the Transportation Intermediaries Association, the most prominent group representing brokers, has said in its most recent quarterly industry reports.  This chart from TIA's most recent 3PL Market Report shows that average broker margins recently did reach nearly 18% on average, and that margins don't always line up with revenue. Still, many owner-operators don't exactly trust TIA, either.Transportation Intermediaries Association
With the release of Adamo's analysis, the NOOA spokesperson said the report did a good job addressing the need for a representative sample, but "the report's limitation lies in the fact that the sample represents only approximately 20% of DAT’s total broker contribution volume for 2023, which does not fully capture the variability of the freight market or brokers' margins."
Adamo disagreed, to an extent: "While it’s true that this dataset was sampled from a filtered subset of our contribution data and I understand that there is concern over the sample size, I am not sure the exact nature of the concern. Unless NOOA has reason to believe that the 20% was sampled in a way that wasn’t representative" -- over-sampling in a particular geography, for instance, time of year, or other factor -- "then the size of this base dataset is well within the bounds of what would be considered for an analysis of this type."
That is, from a bare-bones data perspective, the sample size ought to be big enough to reflect the general nature of the whole. Consider that presidential election polls, important and well-funded as they are, typically get a sample size of 1,000 or so likely voters. Meanwhile, they're routinely used to make conclusions about the 170 million or so likely voters in the country. Half a million loads is certainly a bigger chunk of the brokered-freight whole. Other disciplines would be more than happy with that, in other words, as a representative sample
Adamo added that NOOA's concern "only has merit if NOOA believes that the sampled data is missing or is skewed towards a biased subset of the total brokered load population."
If NOOA or anyone can demonstrate how the numbers are skewed, Adamo said he's all ears for how to improve the study. "I would like to understand where they believe this bias exists, and I would be more than willing to test for it in the underlying dataset."
Some among NOOA members dismiss DAT's numbers entirely, citing aforementioned data disclaimers and/or lack of third-party audits. NOOA successfully kicked up lots of dust and questions around the DAT margins analysis, yet the organization has not proven the numbers false, or that they're without some merit. Any medicine, plane ticket, new truck from Peterbilt ... comes with some kind of disclaimer. Reports of brokers making massive margins on loads don't get audited, either, in large part, due to confidentiality requirements in contract language.
[Related: More ways to vet brokers to combat fraud, double brokering]
So how much are brokers making off owner-operators?
Brokers make as much money from doing business with you as you let them, in the end. And regardless of how much a broker makes, owner-operators find themselves in a tough market, where better defenses against loss remain knowing your business, cutting costs where you can and owning your backyard by making direct contact with shippers.
It's not hard to find brokers bragging about making 40%, 50%, or even 100% margin on loads. Recently a court found TQL guilty of not paying overtime to 4,500 employees who were "strongly encouraged" to work 60 hours a week, revealing how brokers face pressure to work long hours and drive hard bargains.
[Related: TQL 'offsetting' its way out of paying carriers?]
Maybe that's why many owner-operators distrust brokers, because they're also hardworking and pursuing the best possible profits, only on the carrier side.
Jayme Anderson, a NOOA member owner-operator, said he routinely books loads for $1 to $1.50 higher than DAT's data products average the lanes, something he attributed to being a "hard negotiator" and having an iron grip on his own numbers. Anderson suggested big shippers and brokers cherry-pick the data they submit to systems like those of DAT to manipulate the market. But he also said he ran a mostly cash operation and, like the vast majority of owner-operators, didn't report his rates to DAT, until he was recently invited to by Adamo.
"My specific question is how am I represented in data that determines the rate analytics?" said Anderson, who runs almost entirely on the spot market.
"Under the current structure" of DAT's rate calculations, customers can only be onboarded into the reporting protocol by the company's Data Operations department, explained Adamo, who welcomed more small fleet participation on the platform.
But the NOOA spokesperson suggested that might just be a bid for more customers, and that fraudulent activity on DAT's platform while many small carriers don't contribute directly cast doubt on the averages.
In the entire argument over margins and rates and reporting, a conspicuous lack of trust between the NOOA-affiliated owner-ops and DAT made reconciling the two accounts of the market almost impossible.
Anderson and others at NOOA promised a long-in-the-making project with "more representative" rates data that would debunk DAT's narrative about rates and margins. It remains a work in progress for now, but NOOA hopes to present it to Senators, and then the public, when it's ready.
Adamo said that within DAT's data "the extreme majority of freight moved by brokers comes from the top 1,000 brokers." (Keep in mind, the loads reported by brokers do represent loads hauled by small carriers/owner-operators who haven't been onboarded in DAT's data reporting system.)
"Even though there are 27,000 active freight brokerages, the top 1,000 control 80% of the domestic transportation management market," research from Hill's Brush Pass Research indicated.
So there may be some truth to the smallest carriers and brokers missing out on representation in DAT's data products, but if they don't report the loads to anyone, how could DAT possibly include them?
As these larger questions swarm around trucking, we'll continue to seek answers. We invite anyone with meaningful challenges to either DAT or NOOA's narrative on rates to contact alexlockie@randallreilly.com.
Make your voice heard on broker margins
Overdrive invites you to continue the conversation on broker margins by completing the following two-question survey. Don't forget to tap/click the "finish survey" button after making your response selections.
from Overdrive https://ift.tt/NpXnYcq


Sourced by Quik DMV - CADMV fleet registration services. Renew your registration online in only 10 minutes. No DMV visits, no lines, no phone mazes, and no appointments needed. Visit Quik, Click, Pay & Print your registration from home or any local print shop.


0 comments:
Post a Comment